
- Data Clique’s exclusive custom mapping reports
- Quickly visualize where your best customers live
- Pinpoint where to find prospects who look just like your current best customers
- Select individual households rather than entire zip codes
- Less waste + Better response rates = More customers
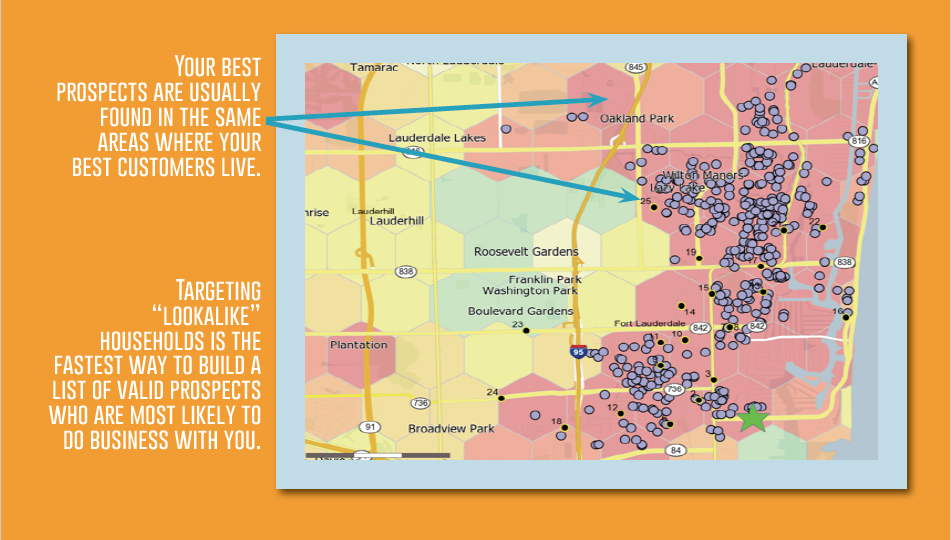
Each hexagon on this map represents where to find the most potential customers for your business. The darker the hexagon, the greater the number of “matching” households within that neighborhood. The circles are previous or current customers. It’s easy to see which areas are primary targets for new prospects. The lighter shaded hexagons (in yellow and green), contain fewer “matching” households. Data Clique can map every territory your business covers so you can see the similarities and differences from market to market.
